Pricetarget: If Bitcoin reaches the total investment value of gold, it can reach about $142,000 to $150,000.
Update to my pricing models:
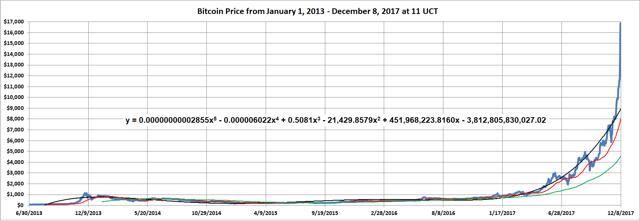
Model 1: Below is a graph of Bitcoin’s price during June 30, 2013 – December 8, 2017, at 11 UTC. The green line is the 200-day moving average, and the red line is the 50-day moving average. The black line is the polynomial best fit trendline.
Source: Created from Coindesk’s Bitcoin Data
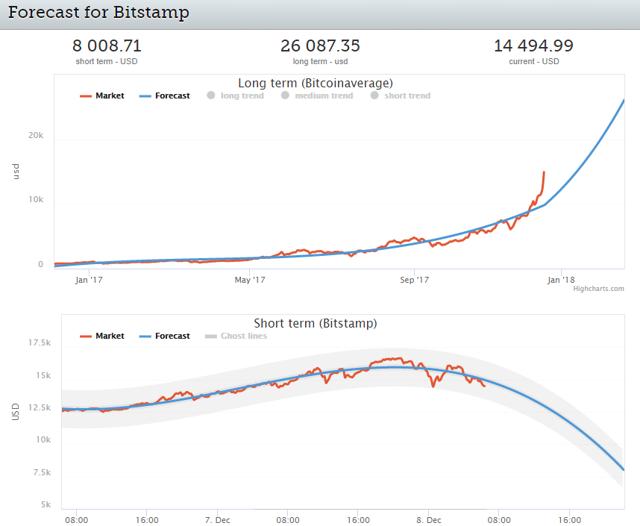
The trendline gives a price for Bitcoin on Thursday, December 8, 2017, of $8,971.87, compared to the price of $14,852.01 at 11:00 UTC. The model price is not too far below bitstamp’s short-term Bitcoin forecast shown below, which says the price would be $8,008.71 on December 8 at 22:20 UTC. The model price is also not too far below bitstamp’s long-term Bitcoin forecast of $26,087.35 on April 5, 2018. The trendline gives a predicted price of $18,921.44 on April 5, 2018.
Model 2: The price of Bitcoin seems to follow a minimum price, which can be modeled by omitting the price spikes (outliers). Below is a graph of Bitcoin’s price when omitting outliers from June 30, 2013 to December 8, 2017, at 11 UTC. The green line is the 200-day moving average, and the red line is the 50-day moving average. The solid black line is the polynomial best fit trendline, which gives a price of $4,461.22 for December 8, 2017, and $7,950.36 on April 4, 2018.
Source:
| Bitcoin To Reach About $142,000 Or More |
| By Michael Bryant |

